Graphic Support for Water Program Series
 The U.S. EPA’s Strategic Plan calls for the Agency to evaluate its progress in protecting and improving water quality. For several years, IEc has contracted with EPA to produce the report series titled National Water Program Performance, Trends, and Best Practices. Published annually, each report examines progress made toward meeting 21 “strategic measures” designed to demonstrate whether the Agency is fulfilling its obligations related to safe drinking water, clean surface waters, and healthy coastal environments. The reports also examine progress against Agency Priority Goals, select water-related initiatives such as green infrastructure development, and improvement of small water utilities.
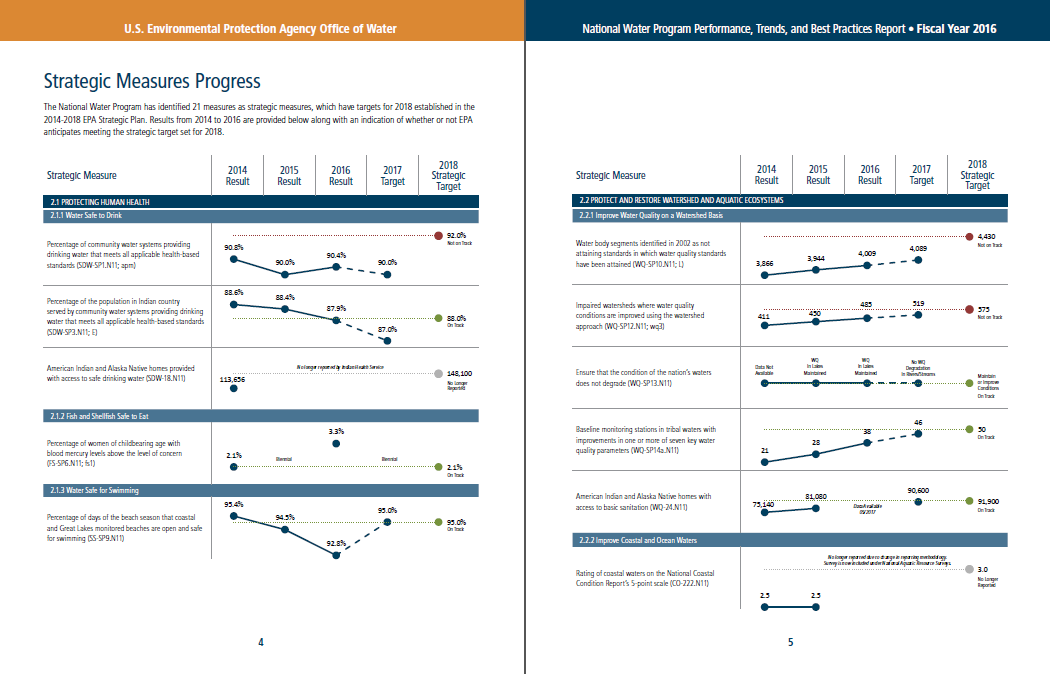
IEc worked in Adobe InDesign to craft the layout for the Performance Reports for fiscal years 2017, 2016, 2015, and 2014. The reports are designed for the general public, so a strong emphasis is placed on non-technical language, crisp organization, and visual appeal. Photographs and accessible charts feature prominently. IEc is responsible for developing a range of graphics – bar charts, trend lines, sidebars, tables, and maps – that quickly convey key messages for a lay audience. At the same time, the graphics must convey detailed findings on the 21 strategic measures via a set of 110 underlying performance measures. IEc’s work carefully balances clarity and readability with technical rigor and completeness.
Full Report Client U.S. Environmental Protection Agency